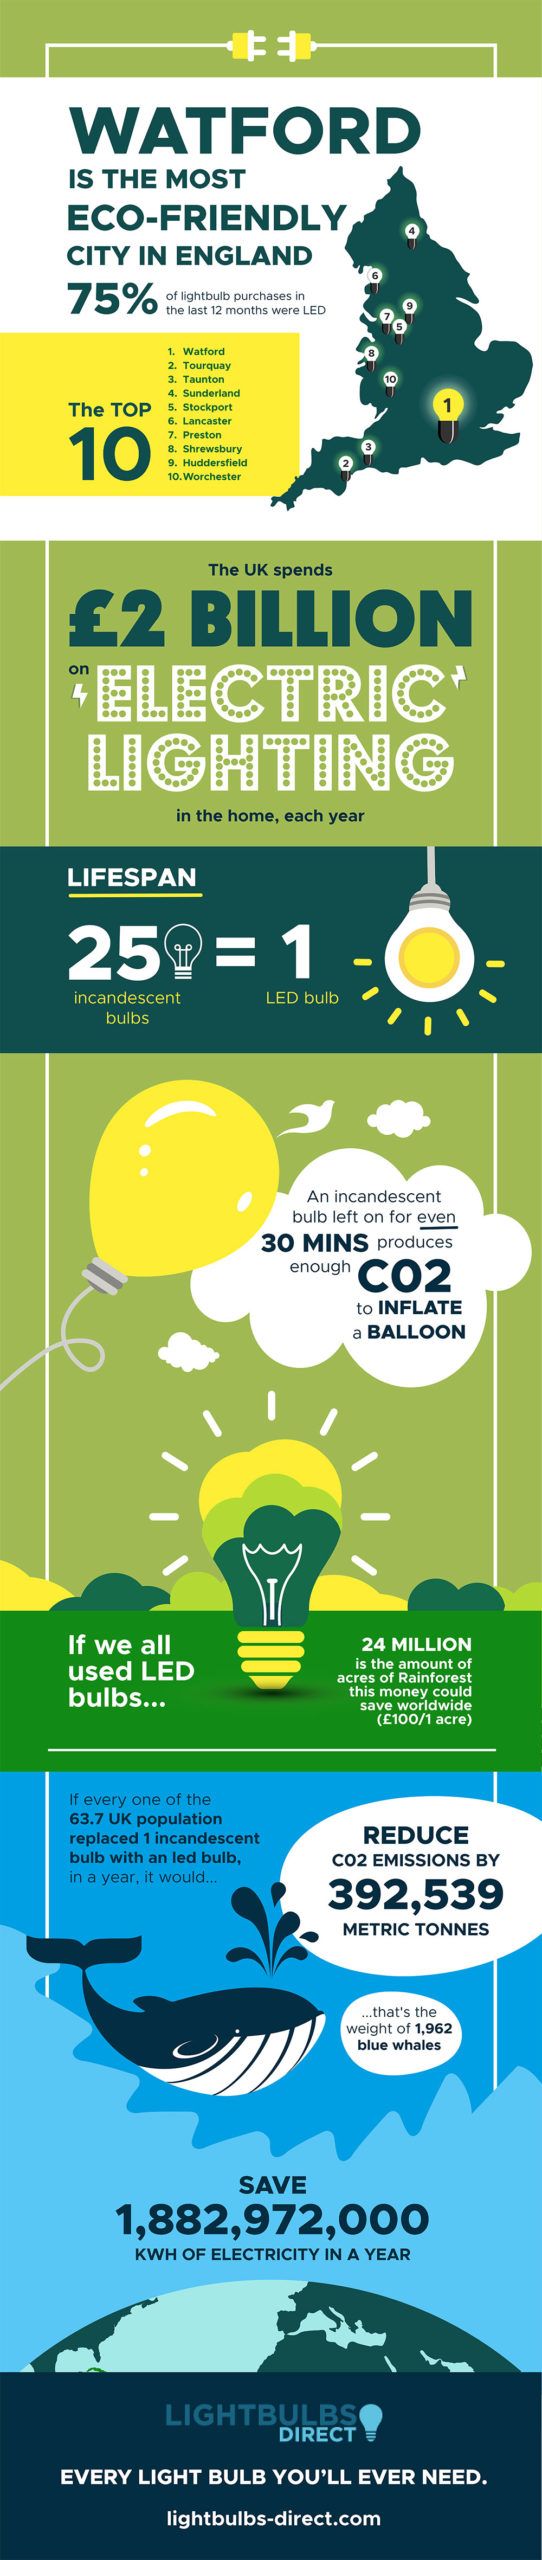
Watford is the most energy conscious area in England when it comes to buying LED energy saving light bulbs.
According to independent research by Lightbulbs Direct, over 75% of lightbulb purchases in Watford over the last 12 months, have been of the LED variety.
Seven of the bottom ten places in England are occupied by parts of London (East Central London, Romford, Southall, West Central London, Enfield and Ilford); with Birmingham, Liverpool and Manchester also buying far less LED lights than most of the rest of the country.
LED lights are far more energy efficient than other bulbs, and the lower temperature means that they are also far safer to operate.
The statistics show that if more people purchased LED lighting, then the environment would benefit.
Speaking exclusively to Lightbulbs Direct, nature and climate journalist Lucy Siegle said:
Well I think LED lighting has been a game changer in terms of reducing energy demand from lighting. We have to remember that during the big switch when people switched from filament bulbs to LED in a major way, the average amount of electricity needed annually to light a UK home fell by 30%. So in some ways, you could say that LEDs set us on the road to Net Zero and major decarbonising. What it is easy to forget is how much push back there was including whole counter campaigns trying to establish the incandescent bulb as a quasi-religious freedom. But in the end, the savings for consumers and the fact that LEDs are widely available and have improved in function, means that the pushback quickly looked ridiculous.
In 1962, Nick Holonyak, Jr. invented the first LED that could produce visible red light, and the range has developed and grown across the world ever since.
Speaking after the findings the Mayor of Watford Peter Taylor said that he too was delighted his town was making such a positive impact on the environment.
We have put a lot of work into making Watford a more sustainable town over recent years, and, I am proud of how far we have come, including supporting local businesses to cut down on their carbon emissions and offering sustainable transport options in the town.
The average energy saving by switching to LED lighting, could be as much as 80-90% over traditional filament lighting – with a typical LED light bulb consuming only 5W of power compared to 50W consumed by a traditional filament light bulb of equivalent brightness.
The appeal to shoppers is that this also equates to a big saving on energy bills, which, when combined to LEDs vastly longer lifespan, means that LED lighting offers the most cost-effective form of lighting.
Percentage of LED v Non-LED Lighting Bought by Town
| Town | % LED Lighting Purchased | % Non-LED Lighting Purchased |
|---|---|---|
| Watford | 76.2% | 23.8% |
| Kirkwall | 75.9% | 24.1% |
| Torquay | 75.6% | 24.4% |
| Taunton | 73.1% | 26.9% |
| Sunderland | 73.0% | 27.0% |
| Dundee | 72.6% | 27.4% |
| Stockport | 72.4% | 27.6% |
| Lancaster | 71.5% | 28.5% |
| Preston | 71.5% | 28.5% |
| Shrewsbury | 71.4% | 28.6% |
| Swansea | 71.0% | 29.0% |
| Huddersfield | 70.1% | 29.9% |
| Worcester | 70.1% | 29.9% |
| Redhill | 69.7% | 30.3% |
| Lerwick | 69.4% | 30.6% |
| Inverness | 69.3% | 30.7% |
| Hereford | 69.1% | 30.9% |
| Canterbury | 68.2% | 31.8% |
| Reading | 68.1% | 31.9% |
| Crewe | 68.0% | 32.0% |
| Exeter | 67.8% | 32.2% |
| Hull | 67.8% | 32.2% |
| Llandudno | 67.5% | 32.5% |
| Kilmarnock | 67.2% | 32.8% |
| Falkirk | 67.2% | 32.8% |
| Blackburn | 67.2% | 32.8% |
| Cardiff | 67.1% | 32.9% |
| Blackpool | 67.0% | 33.0% |
| Cambridge | 67.0% | 33.0% |
| Darlington | 66.9% | 33.1% |
| Sutton | 66.4% | 33.6% |
| Slough | 66.4% | 33.6% |
| Harrogate | 65.8% | 34.2% |
| Walsall | 65.8% | 34.2% |
| Peterborough | 65.8% | 34.2% |
| Stoke-on-Trent | 65.7% | 34.3% |
| Tunbridge Wells | 65.5% | 34.5% |
| Oxford | 65.4% | 34.6% |
| Bolton | 65.4% | 34.6% |
| Carlisle | 65.2% | 34.8% |
| Colchester | 65.2% | 34.8% |
| Norwich | 65.2% | 34.8% |
| Swindon | 65.1% | 34.9% |
| Dumfries | 64.8% | 35.2% |
| St Albans | 64.7% | 35.3% |
| York | 64.7% | 35.3% |
| Warrington | 64.6% | 35.4% |
| Hemel Hempstead | 64.4% | 35.6% |
| Gloucester | 64.4% | 35.6% |
| Plymouth | 64.3% | 35.7% |
| Chester | 64.3% | 35.7% |
| Leeds | 64.0% | 36.0% |
| Motherwell | 63.9% | 36.1% |
| Milton Keynes | 63.8% | 36.2% |
| Perth | 63.6% | 36.4% |
| Kingston upon Thames | 63.5% | 36.5% |
| Bristol | 63.1% | 36.9% |
| Sheffield | 63.1% | 36.9% |
| Bromley | 63.0% | 37.0% |
| Chelmsford | 62.9% | 37.1% |
| Teesside | 62.8% | 37.2% |
| Doncaster | 62.7% | 37.3% |
| Guildford | 62.3% | 37.7% |
| Durham | 62.0% | 38.0% |
| Croydon | 61.9% | 38.1% |
| North London | 61.8% | 38.2% |
| Tweeddale | 61.7% | 38.3% |
| Truro | 61.5% | 38.5% |
| Southend-on-Sea | 61.4% | 38.6% |
| Llandrindod Wells | 61.4% | 38.6% |
| Brighton | 61.3% | 38.7% |
| Bath | 61.1% | 38.9% |
| Harrow | 61.0% | 39.0% |
| Nottingham | 60.9% | 39.1% |
| Bradford | 60.9% | 39.1% |
| Wakefield | 60.8% | 39.2% |
| Newport | 60.8% | 39.2% |
| Coventry | 60.8% | 39.2% |
| Aberdeen | 60.7% | 39.3% |
| Derby | 60.6% | 39.4% |
| Glasgow | 60.5% | 39.5% |
| Halifax | 60.2% | 39.8% |
| Southampton | 59.7% | 40.3% |
| Lincoln | 59.6% | 40.4% |
| Leicester | 59.5% | 40.5% |
| Twickenham | 59.4% | 40.6% |
| South East London | 59.4% | 40.6% |
| Medway | 59.3% | 40.7% |
| Stevenage | 59.2% | 40.8% |
| Northampton | 58.5% | 41.5% |
| Dartford | 58.0% | 42.0% |
| Dudley | 58.0% | 42.0% |
| Bournemouth | 57.9% | 42.1% |
| Wolverhampton | 57.8% | 42.2% |
| Edinburgh | 57.5% | 42.5% |
| Oldham | 57.4% | 42.6% |
| Dorchester | 57.0% | 43.0% |
| Telford | 56.3% | 43.7% |
| Newcastle upon Tyne | 56.0% | 44.0% |
| Salisbury | 55.7% | 44.3% |
| South West London | 54.7% | 45.3% |
| Wigan | 54.6% | 45.4% |
| Paisley | 54.0% | 46.0% |
| West London | 53.9% | 46.1% |
| Ipswich | 53.9% | 46.1% |
| Portsmouth | 52.7% | 47.3% |
| North West London | 52.3% | 47.7% |
| Luton | 51.6% | 48.4% |
| Ilford | 51.6% | 48.4% |
| Manchester | 51.1% | 48.9% |
| Enfield | 50.0% | 50.0% |
| Liverpool | 49.7% | 50.3% |
| Birmingham | 49.5% | 50.5% |
| East London | 44.8% | 55.2% |
| West Central London | 43.7% | 56.3% |
| Southall | 41.8% | 58.2% |
| Romford | 38.0% | 62.0% |
| East Central London | 37.9% | 62.1% |
Related Posts:
 Energy Saving FAQSaving energy is good for the environment as well as your bank balance and, with modern lighting technology, is as easy as...
 Frequently Asked Questions (FAQ)How are you able to offer such low prices? Lightbulbs Direct uses a “direct only”, low overhead business model. We have no...
 Smart meters and the benefits of upgradingThere has been a lot of publicity recently about the benefits of upgrading your gas and electricity meters to ‘smart meters.’ Millions...
 New EU energy labels regulation changesYou may have noticed that there were some changes introduced light bulb’s energy labels in 2021. Since 1st September 2021, the energy...